
Buffon’s needle problem: manim visualization
Published:
The video above illustrates the famous Buffon’s needle problem. This experiment can be used to design a Monte Carlo method for approximating the number $\pi$. That’s why this example is considered to be a classic Monte Carlo implementation.
Description of the experiment
In the simplest case, the Buffon’s needle problem is formulated as follows: if needles or sticks of length $L$ were accidentally thrown on a flat surface with parallel lines drawn on it at a distance $D \geq L$ from each other, the probability $P_{\text{cross}}$ of the thrown needle crossing one of these lines can be expressed as:
\[\label{eq:prob} P_{\text{cross}}=\frac{2L}{\pi D}.\]Proof of the result
The proof for this particular case is quite trivial. Suppose a needle of length $L$ is dropped onto a floor with evenly spaced parallel lines of width $D$ (see fig. 1). The probability of the event where the needle crosses a line was shown above (see eq. \eqref{eq:prob}), but how to get this result?

To solve the problem we must develop a method of “locating” a needle of length $L$ that has fallen onto the floor. Let $x$ be the perpendicular distance from the end of the needle nearest you to the nearest line above it. Let $\theta$ be the acute angle between the needle and a line through the end of the needle nearest you, parallel to the line (see fig. 2).

Now let $t$ be the perpendicular distance from the other end of the needle to this line. We see that $\sin{\theta} = \frac{t}{L}$, so $t = L\sin{\theta}$.
It can be seen, if $t > x$, then the needle will cross the line. Thus, we have a successful toss when $x < L\sin{\theta}$. We also note that the following restrictions fall on $\theta$ and $x$: $0 \leq \theta \leq \frac{\pi}{2}$ and $0 \leq x \leq D$.
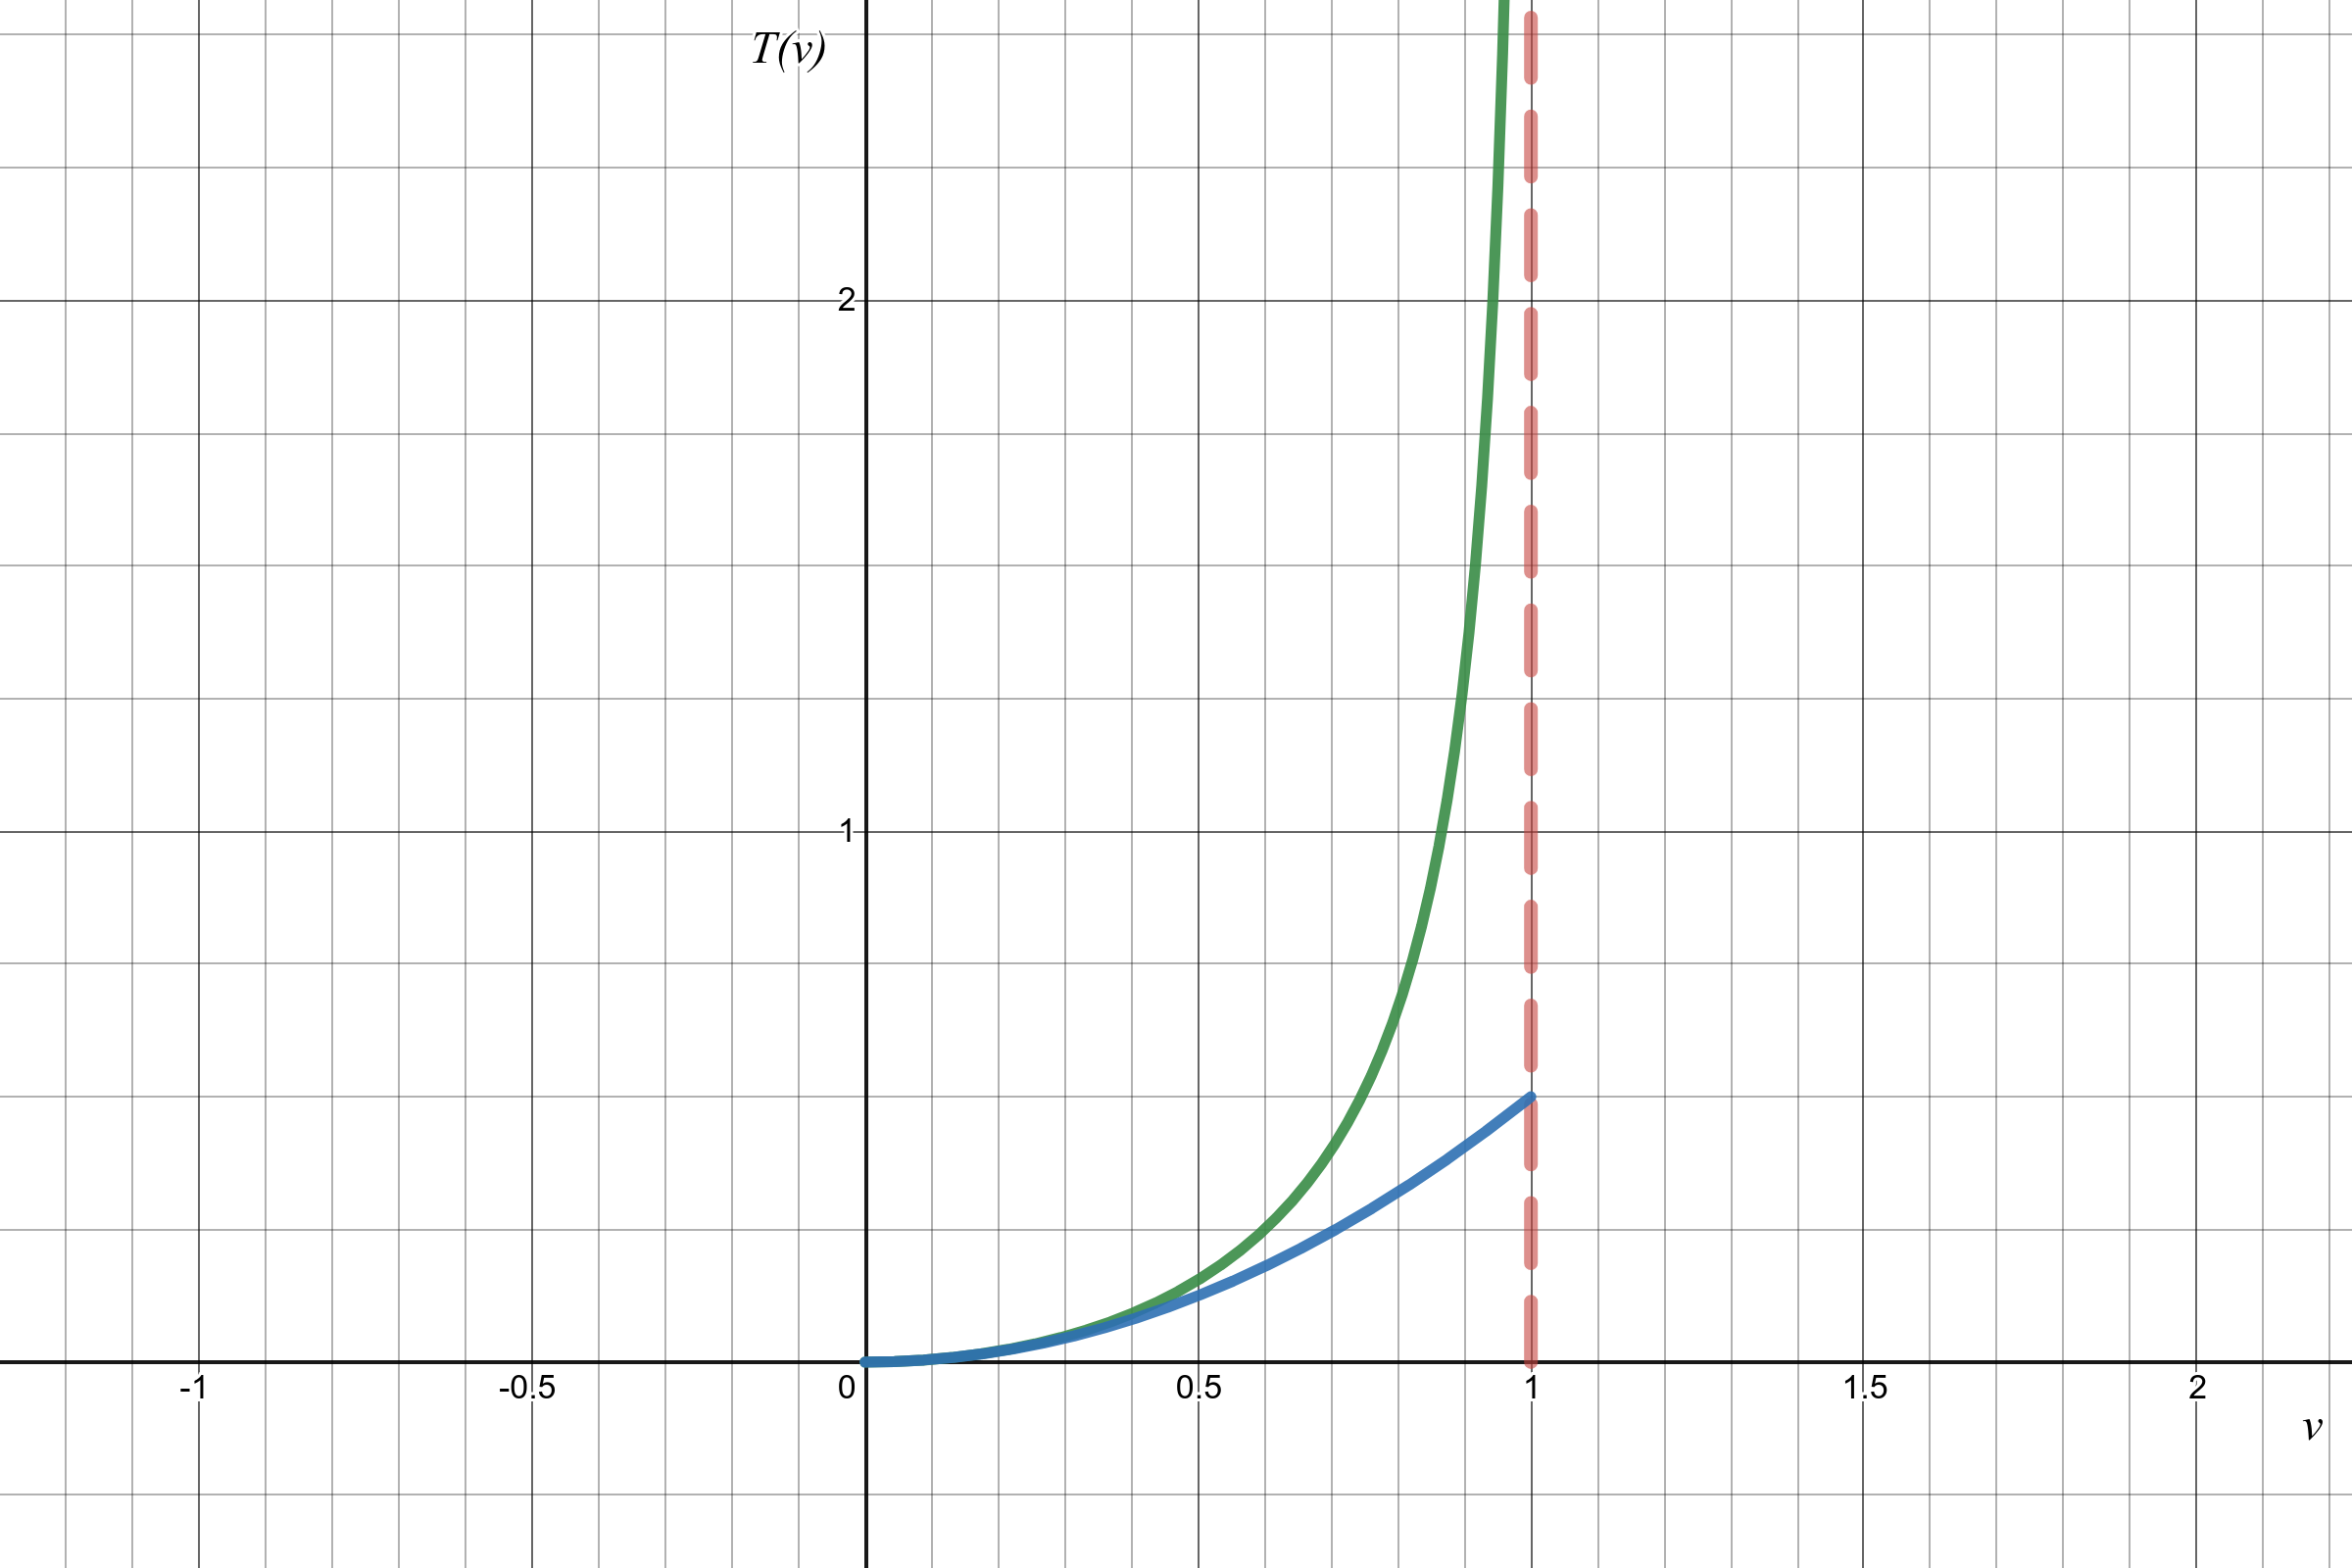
In the desmos below see the resulting rectangle from blue and green restrictions areas. This rectangle constitutes the sample for our experiment. The variables for the experiment are $\theta$ and $x$, and we consider $D$ and $L$ as constants.
For simplicity, let’s consider only the $D \geq L$ case of possible relationships between $D$ and $L$. From the desmos we can see, that the probability that a toss is a success is:
\[\label{eq:prob_proof_text} P_{\text{cross}}=\frac{\text{area under the curve}}{\text{area of the rectangle}},\]that is,
\[\label{eq:probability_proof} P_{\text{cross}}=\frac{L\int_0^{\pi/2}{\sin{\theta}d\theta}}{D\frac{\pi}{2}}=\frac{(-\cos{\frac{\pi}{2}})-(-\cos{0})}{\frac{D\pi}{2L}}=\frac{2L}{D\pi}(-0+1)=\frac{2L}{\pi D},\]So, that’s how we get the result from eq. \eqref{eq:prob}.
Suppose we estimated $P_{\text{cross}}$ not analytically but empirically, by throwing needles, let’s call it $\hat{P}_{\text{cross}}$. Thus,
\[\hat{P}_{\text{cross}}\approx\frac{2L}{\pi D},\]or
\[\label{eq:pi_est} \pi\approx\frac{2L}{\hat{P}_{\text{cross}} D}.\]Using this hack we can estimate the $\pi$ number dropping a needle on the floor!
This can be seen from the video at the top of the page, there $L = D = 1$ and $\hat{P}_{\text{cross}}=\frac{S}{N}$, where $N$ — number of throws, $S$ — number of crossings. So, the $\pi$ estimation, following eq. \eqref{eq:pi_est} can be found as $\pi\approx\frac{2N}{S}$.
After 100 throws we estimated $\pi\approx3.226$, surely, the more throws we make, the better the result will be.
Now you should understand the video from the beginning 😉


Leave a Comment